Historical Utility Costs
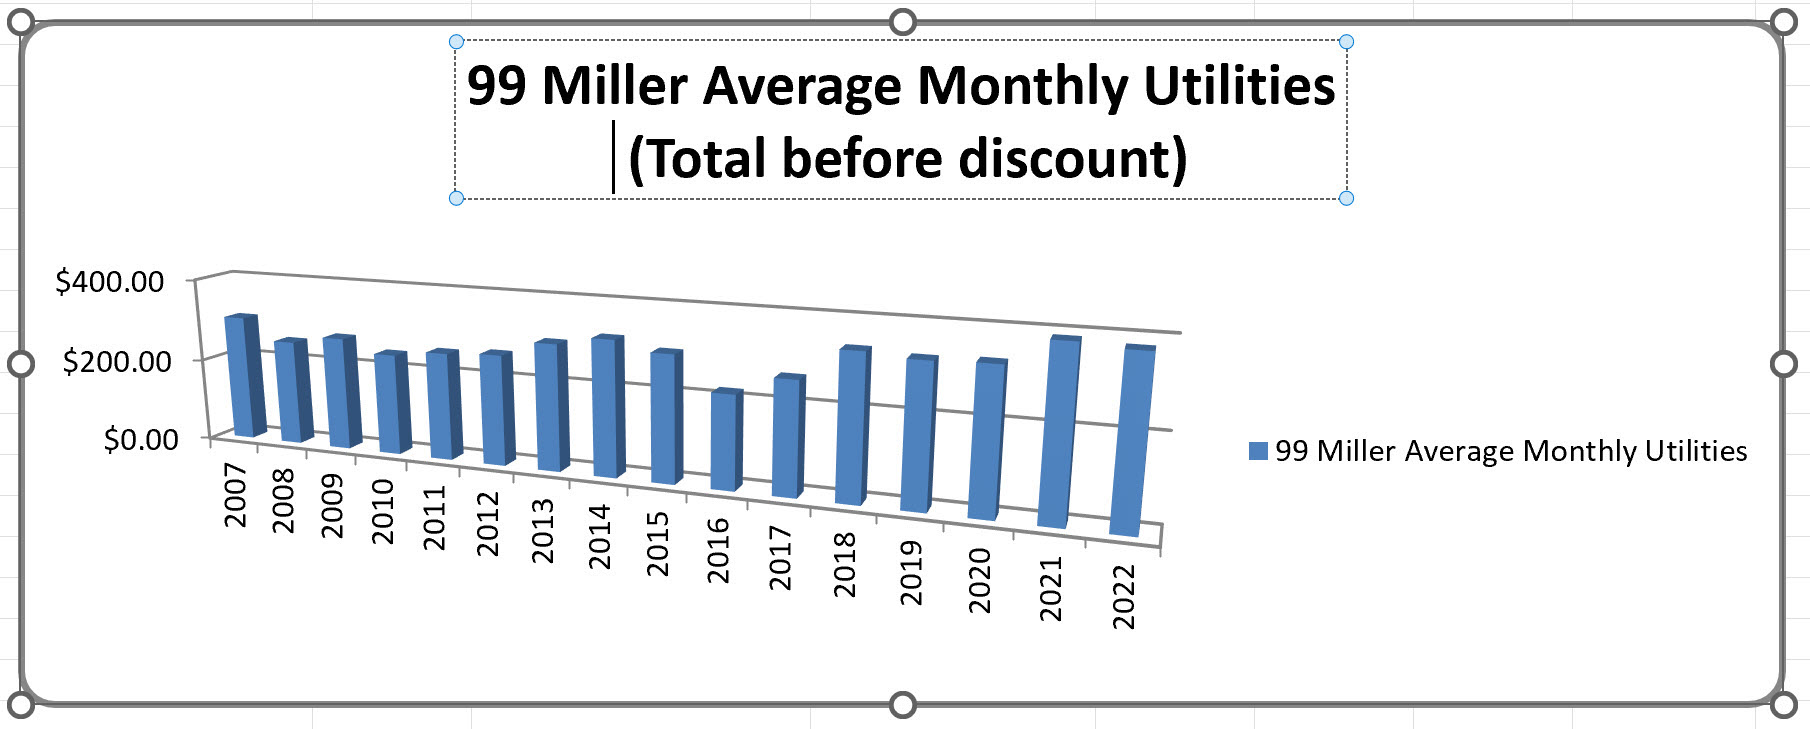
Below is a graph that shows the historical monthly averages since we have been keeping records. Cost will of course vary by use and by the rates the utility companies charge. The chart below shows the average for the whole year. Naturally some months are more expensive than others - namely July and Aug tends to be more expensive for hydro (electricity) because of the use of the central Air Conditioner and January and February because of the use of natural gas. To keep things simple we ask that the post dated rent cheques include the average monthly rent. We keep track of the utility costs and reconcile twice yearly - meaning if you have overpaid based on actuals we will refund you the amount or if you use more than what you have paid we will ask you to eTransfer the outstanding amount. We post the utility bills on line and can view them anytime.
Below is the historical amounts to give you a feel for the average monthly cost.